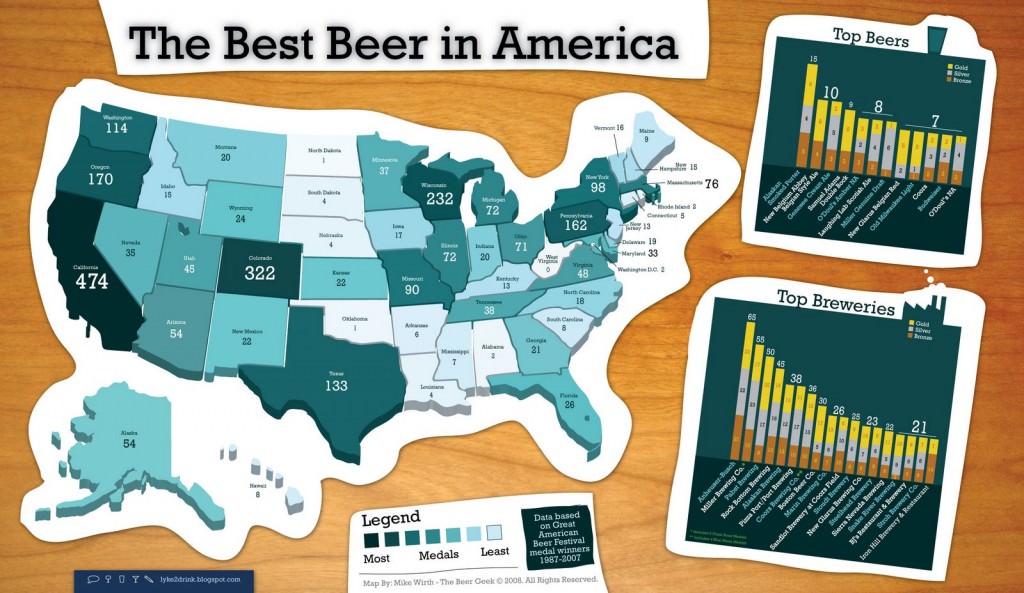
Info graphics have become popular over the past year or two due to the way most of them layout data in an extremely visual way. Perhaps one of the main reasons info graphics has exploded in popularity, however, is their use as “link bait”.
Information graphics tend to be very eye catching and are usually so well done that people want to share them with others via email, social networks, etc. This has become a prime motivator for designers to put together information graphics, as a way of attaining links from other websites or social networks. So in a way, information graphics have been used as an SEO strategy to gain back links and increase website popularity.
For those of you new to information graphics, here is an example of one that I personally like:
Click here to see the full size version.
As you can see, this information graphic is eye catching, informative, and if you are a beer enthusiast like me, makes you want to share it with other beer enthusiasts.
Here is a great write up including the top 10 information graphics from 201o.


